

Relative Strength Index (RSI)
 |
| Relative Strength Index (RSI) |
Few People Know and few may not know.
What is RSI?
How it is RSI use?
Let's go and understand one by one
What is RSI? - Full form of RSI is Relative Strength Index, it is one type of Technical analysis indicator. It is developed by Mr. J. Weller. Wilder.
It is a momentum indicator that measure the speed and change of price movement. It also help to judge the stock movement direction upward or downward. we will see further in the article.
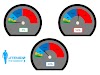
How RSI is used? - Basically RSI work between 0 to 100 on charts. Based on past study and factual trial data it is found that it work mostly between two important limits i.e upper and lower limit inside 0 to 100 scale on charts.
What is RSI Upper and Lower Limit -
RSI Upper Limit - The upper limit is 70 and if value moves above this limit then it is understandable that the stock enter into the Overbought Area. From this reason there may be quite large chance of stock falling down and used as a technical selling zone.

RSI Lower Limit - Similar way the lower limit is 30 and if value moves below 30 limit then it is understandable that the stock enter into the Oversold Area and there is quite large chance of stock may move upward and used as a technical buying zone.

So Friend now use of RSI is quite clear to all of you. Next we will going to learn other type of Technical indicators one by one.
Disclaimer - This is only for knowledge and information sharing and not for any type of recommendation.


 How to Use It?)
1 Comments
Very informative.
ReplyDeletePlease do not enter any spam in the comment box.